

Something shifted in real estate marketing over the past two years, and it didn’t happen quietly. By 2024, over 72% of urban real estate firms had adopted 3D rendering to visualize unbuilt projects and pre-sell properties before a single wall existed. That’s not an early-adopter statistic. That’s a majority. Rendering stopped being a nice-to-have visual extra somewhere along the way and became standard infrastructure for how developers sell property before it’s built.
This report looks at the numbers behind that shift. Why it’s happening now, where the growth is concentrated, what the market is actually worth, and where this technology is headed next.
The Forces Behind the Progressive Shift of 3D Rendering in Real Estate
Table of Contents
Three things converged to make this the moment rendering went mainstream.
● AI-assisted rendering tools cut production time and cost in ways that weren’t possible five years ago. Lighting, texturing, and material work that once required a specialist and days of manual setup can now be generated and adjusted in a fraction of the time.
● Cloud rendering removed the second barrier. Developers no longer need to invest in expensive local hardware to produce photorealistic output, since the heavy computation now happens on rented infrastructure.
● And buyer expectations shifted alongside the tools. A generation of buyers raised on high-fidelity video games and streaming visuals now expects pre-construction marketing to look convincing, not like a rough architectural sketch.
The payoff shows up directly in the data. Real estate 3D renderings have shortened project timelines by up to 32% on average, largely because design revisions happen in software rather than through repeated physical mockups. And pre-construction homes marketed with renderings saw a 25% increase in buyer engagement compared to traditional marketing methods. This is a meaningful jump for developers trying to fill a project before construction even breaks ground.
Where Growth Is Concentrated
The numbers point to a market that’s maturing in some regions while accelerating hard in others. North America currently holds the largest share of both markets tied to this trend, with 35.2% of global 3D rendering revenue and 45% of the virtual staging market, according to industry market trackers. That leadership comes from an already digitized real estate industry, established proptech infrastructure, and high transaction volumes that justify continued investment in visualization tools.
Asia Pacific, meanwhile, is projected to post the fastest growth rate of any region through the early 2030s. The driver isn’t mysterious. It’s the sheer scale of ongoing urban construction and real estate development across the region, which is creating constant demand for a tool built specifically to sell what isn’t finished yet. Europe and the Middle East show smaller but steady adoption curves, following the same underlying logic. Markets with active new-development pipelines are now leaning on rendering hardest.
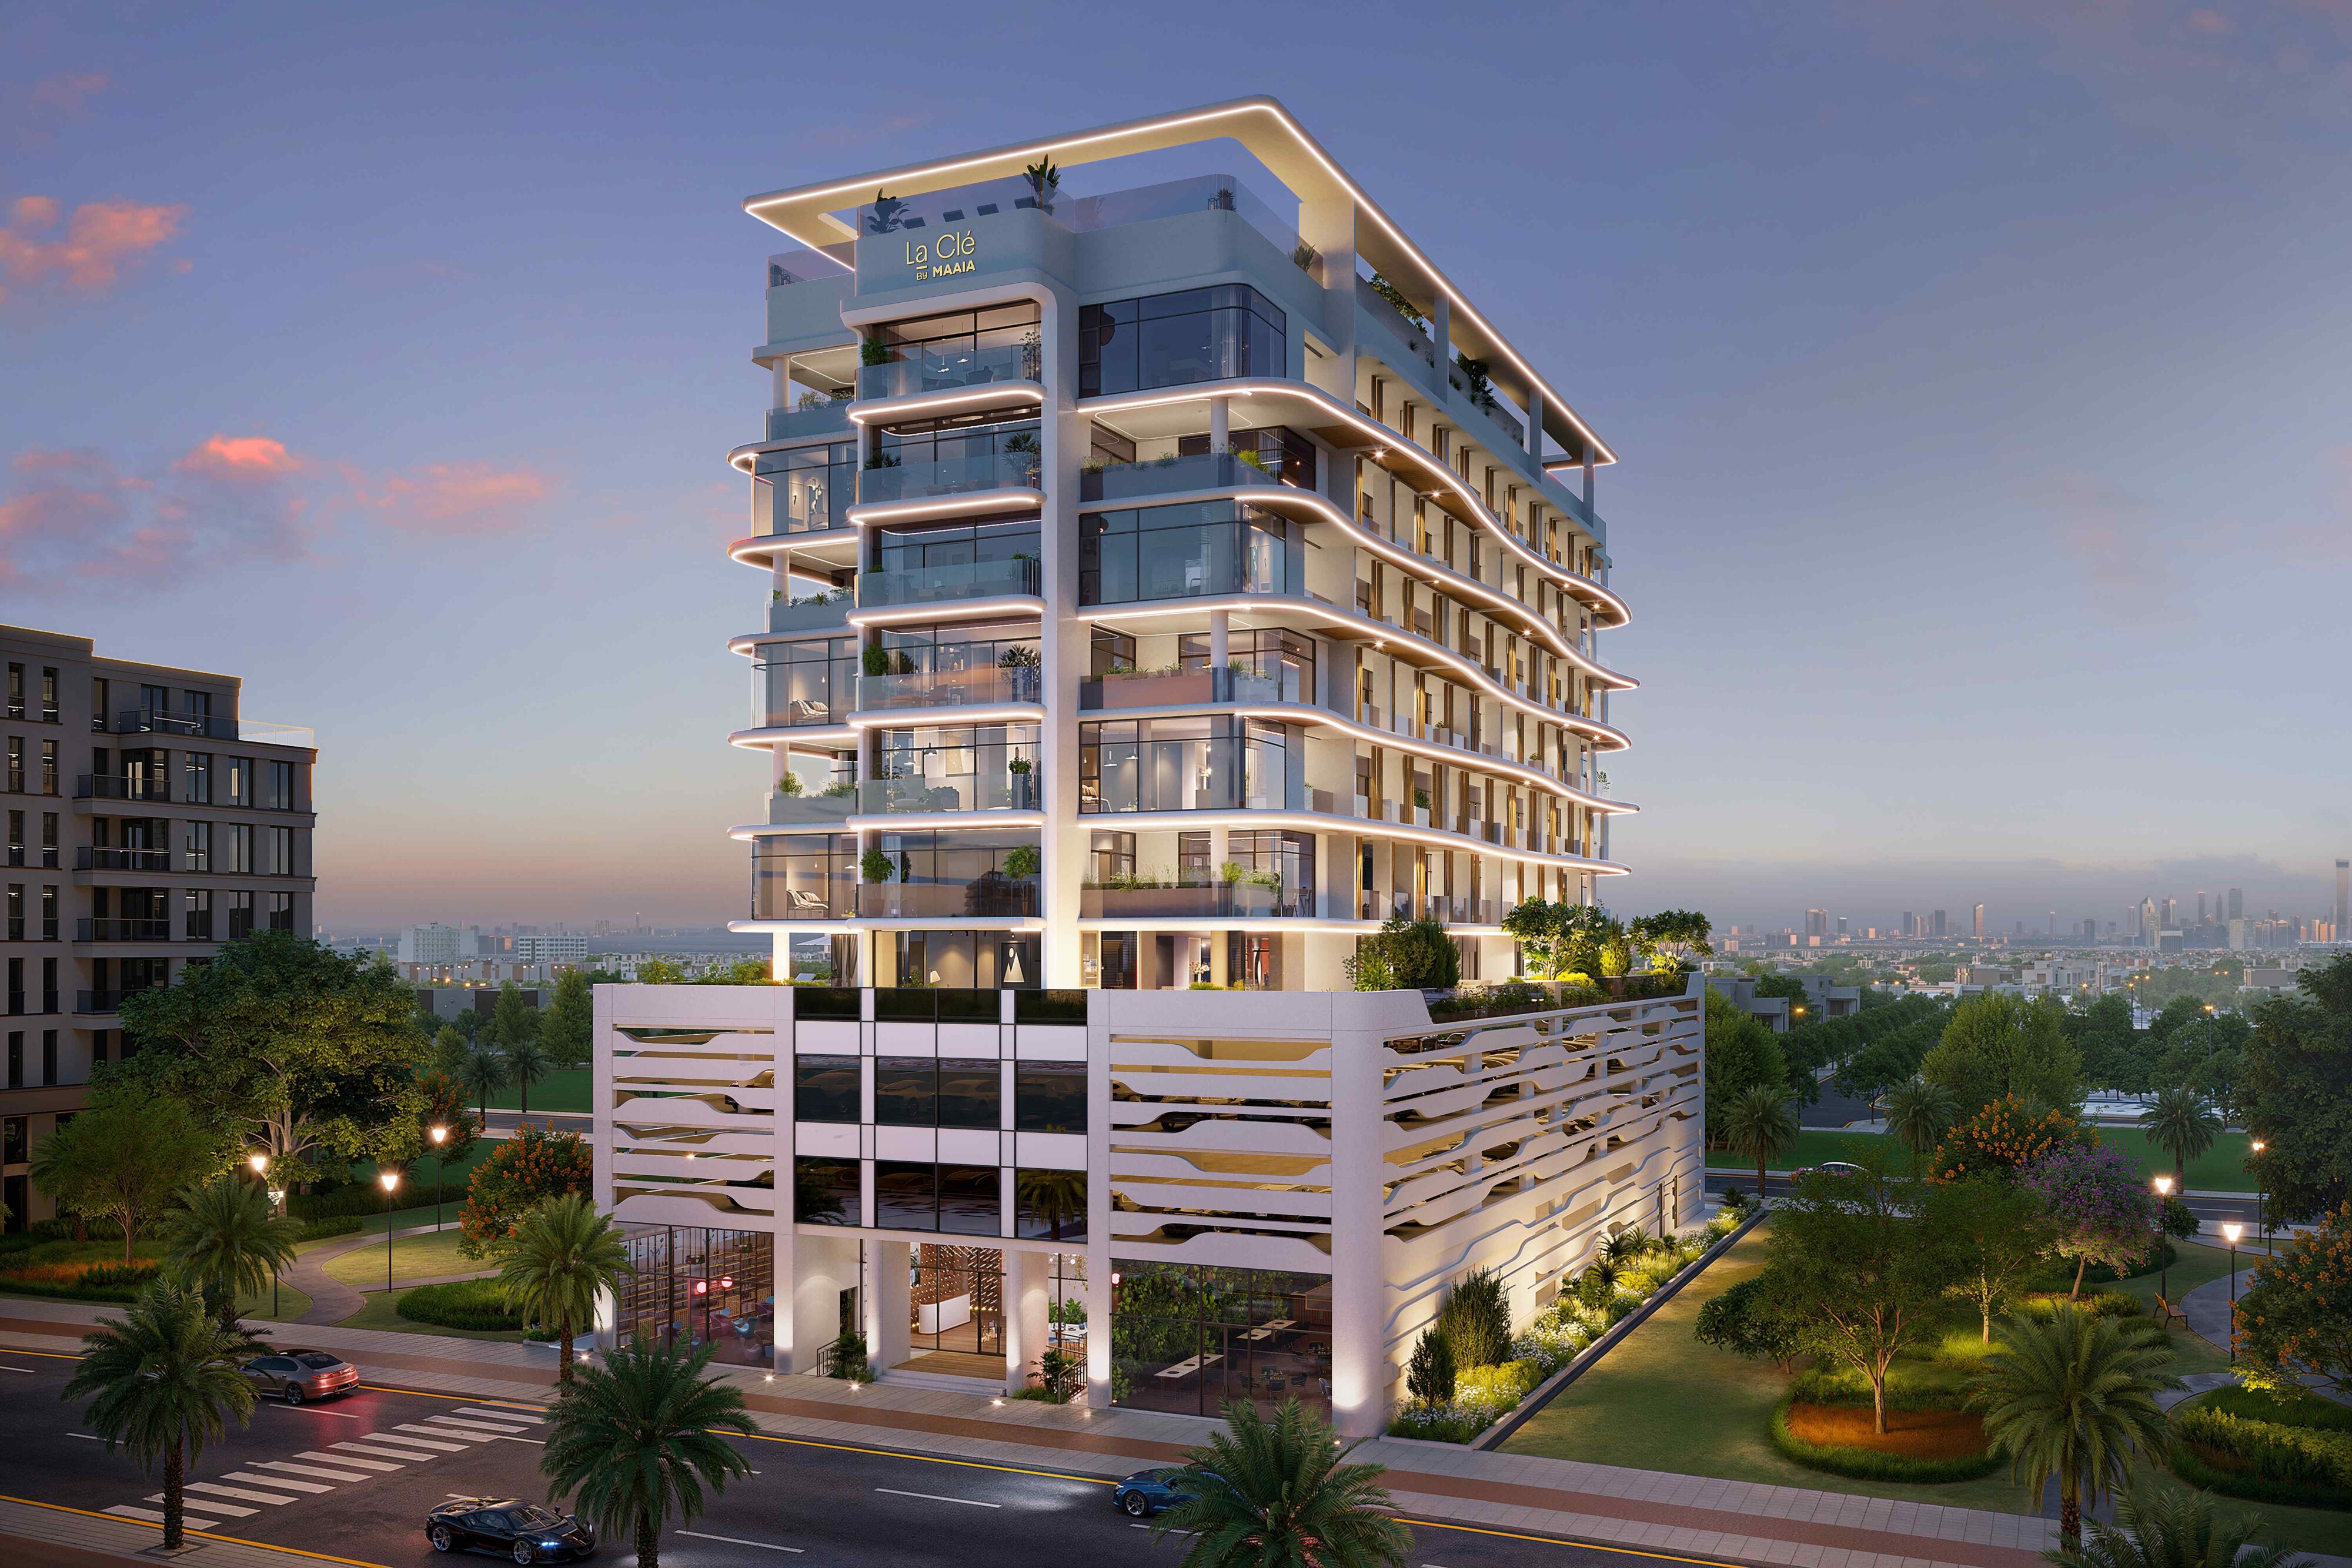
The Market Size Numbers of 3D Rendering in the Global Real Estate Market
Estimates for the current (2026) market size range from roughly $2 billion to $7.5 billion, and long-term forecasts for the early-to-mid 2030s range anywhere from $13 billion to $41 billion, depending on the source and how narrowly or broadly “3D rendering” is defined. Some reports fold in gaming and film visualization, while others isolate architectural and real estate use specifically. Neither figure is wrong exactly. They’re just measuring somewhat different things, or relying on different underlying assumptions.
What’s far more consistent across sources is the growth rate. Nearly every major report places the compound annual growth rate (CAGR) somewhere between 19% and 22% through the early 2030s. When multiple competing firms, using different methodologies, arrive at a similar growth rate, that agreement is a more trustworthy signal than any single revenue projection. If you’re using this data to make a business case, lean on the growth trajectory, not the specific dollar figure.
The Staging Parallel: Rendering's Logic Spreads to Resale
Rendering’s core idea, which was earlier just showing a buyer something that isn’t physically there yet, didn’t stay confined to pre-construction sales. It has now moved downstream into virtual staging, which applies the same visualization principle to vacant, under-furnished, or resale properties instead of unbuilt ones.
The performance numbers here are hard to ignore. Virtually staged listings saw a 90% increase in click-through rate compared to photos of empty rooms, and buyers spent 70% more time on listing pages that use virtual staging. The downstream effect shows up in outcomes that matter more than clicks. Staged homes sold 73% faster than unstaged ones, and closed at 98.5–99% of the asking price, compared to 96–97% for properties marketed without staging.
This is the same technology solving a different problem at a different stage of the property lifecycle. Rendering sells the promise before construction and staging sells the potential of a finished-but-empty space. Together, they cover nearly the entire window during which a property can’t yet show a buyer what it will actually look like when lived in.
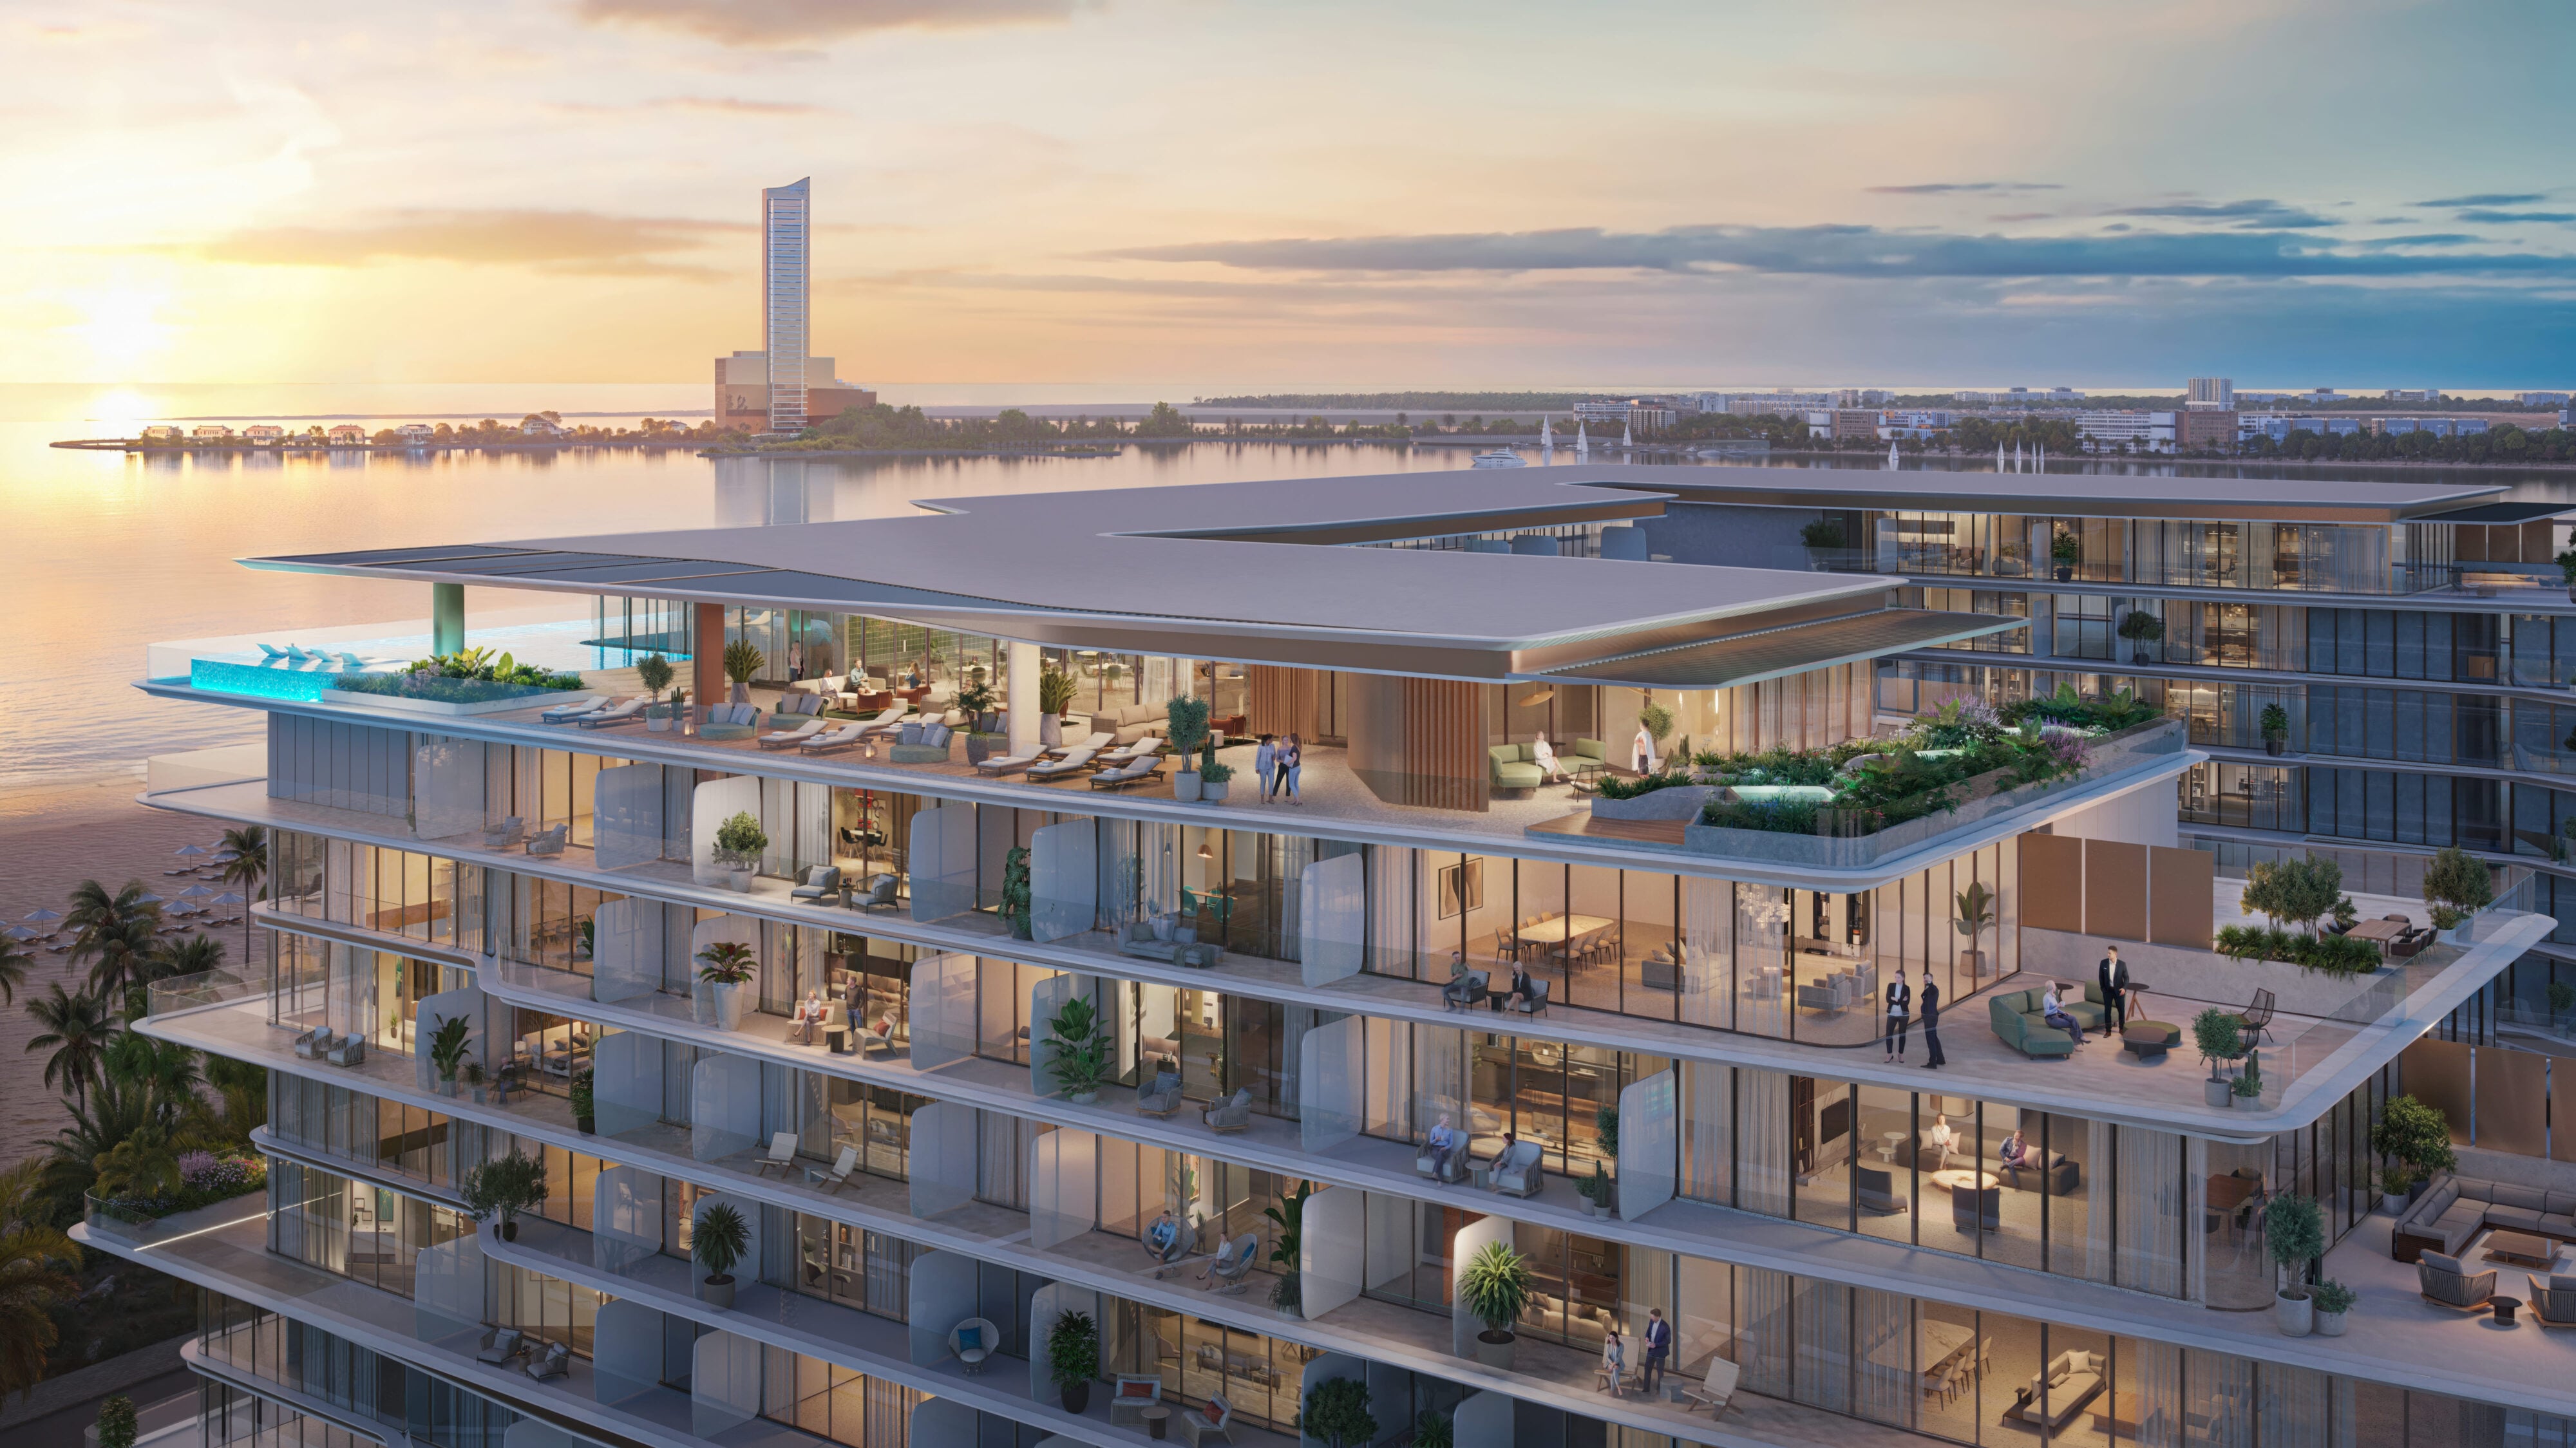
What This Means Going Forward for 3D Rendering for Real Estate
Line these two trends up, and a clearer pattern emerges. The gap between “selling what’s built” and “selling what’s planned” is narrowing across the entire property lifecycle, not just at the pre-construction stage. A developer marketing a project two years from completion and an agent listing a vacant resale unit are now, functionally, solving the same visualization problem with adjacent tools.
For developers and agencies, this changes how rendering and staging budgets should be framed internally. These aren’t marketing line items to be trimmed when budgets tighten. They’re sales infrastructure, in the same category as a CRM or a listing platform, because they directly affect engagement, time-on-market, and closing price. As realism keeps improving and production costs keep falling, expect this to keep compressing sales cycles across the industry. This is not just for the projects that can’t be photographed yet, but for the ones that technically could be and are choosing rendering and staging anyway because it performs better.
FAQ’s
Is 3D rendering actually replacing traditional real estate photography?
No — it’s expanding into a stage photography can’t reach. Over 72% of urban real estate firms adopted 3D rendering specifically for unbuilt projects, where there’s nothing yet to photograph.
Which region leads the global 3D rendering market?
North America currently holds the largest share, accounting for 35.2% of global 3D rendering revenue and 45% of the virtual staging market, driven by an established proptech ecosystem and high transaction volumes.
Why do market-size estimates for 3D rendering vary so much between reports?
Different research firms define “3D rendering” differently. Some include gaming and film visualization, while others include only architectural and real estate use. That’s why 2026 estimates range from roughly $2 billion to $7.5 billion. The growth rate (19–22% CAGR) is far more consistent across sources than the dollar figures.
Does virtual staging actually improve sale outcomes, or just engagement?
Both. Virtually staged listings saw a 90% increase in click-through rate and 70% more time spent on the page, but the effect goes beyond clicks. Staged homes sold 73% faster and closed at 98.5–99% of asking price, versus 96–97% for unstaged listings.
Is Asia Pacific overtaking North America in rendering adoption?
Not yet in overall market share, but it’s growing the fastest of any region through the early 2030s, driven by the scale of ongoing urban development. North America still leads on both current revenue share and virtual staging adoption.

